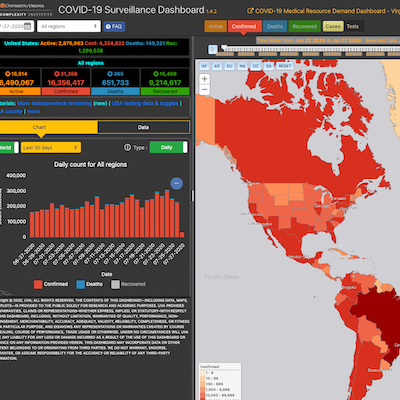
The Biocomplexity Institute at the University of Virginia has been at the forefront of epidemiological modeling to track the COVID-19 pandemic and has developed a suite of COVID-19 epidemic response resources including a series of dashboards to better help the public and the government better understand the pandemic. This is a static view of the Institute’s interactive COVID-19 Surveillance Dashboard, which provides a visualization of COVID-19 cases, recoveries, and deaths across the globe. In an effort to support the planning and response efforts for the recent Coronavirus pandemic, researchers prepared this visualization tool that provides a unique way of examining data curated by different data sources.
https://nssac.bii.virginia.edu/covid-19/dashboard/
|
projects
bioinformatics, covid-19, web